Diagnostics
The Orepath Mining Simulator provides diagnostics for simulation run time and simulation events.
Time
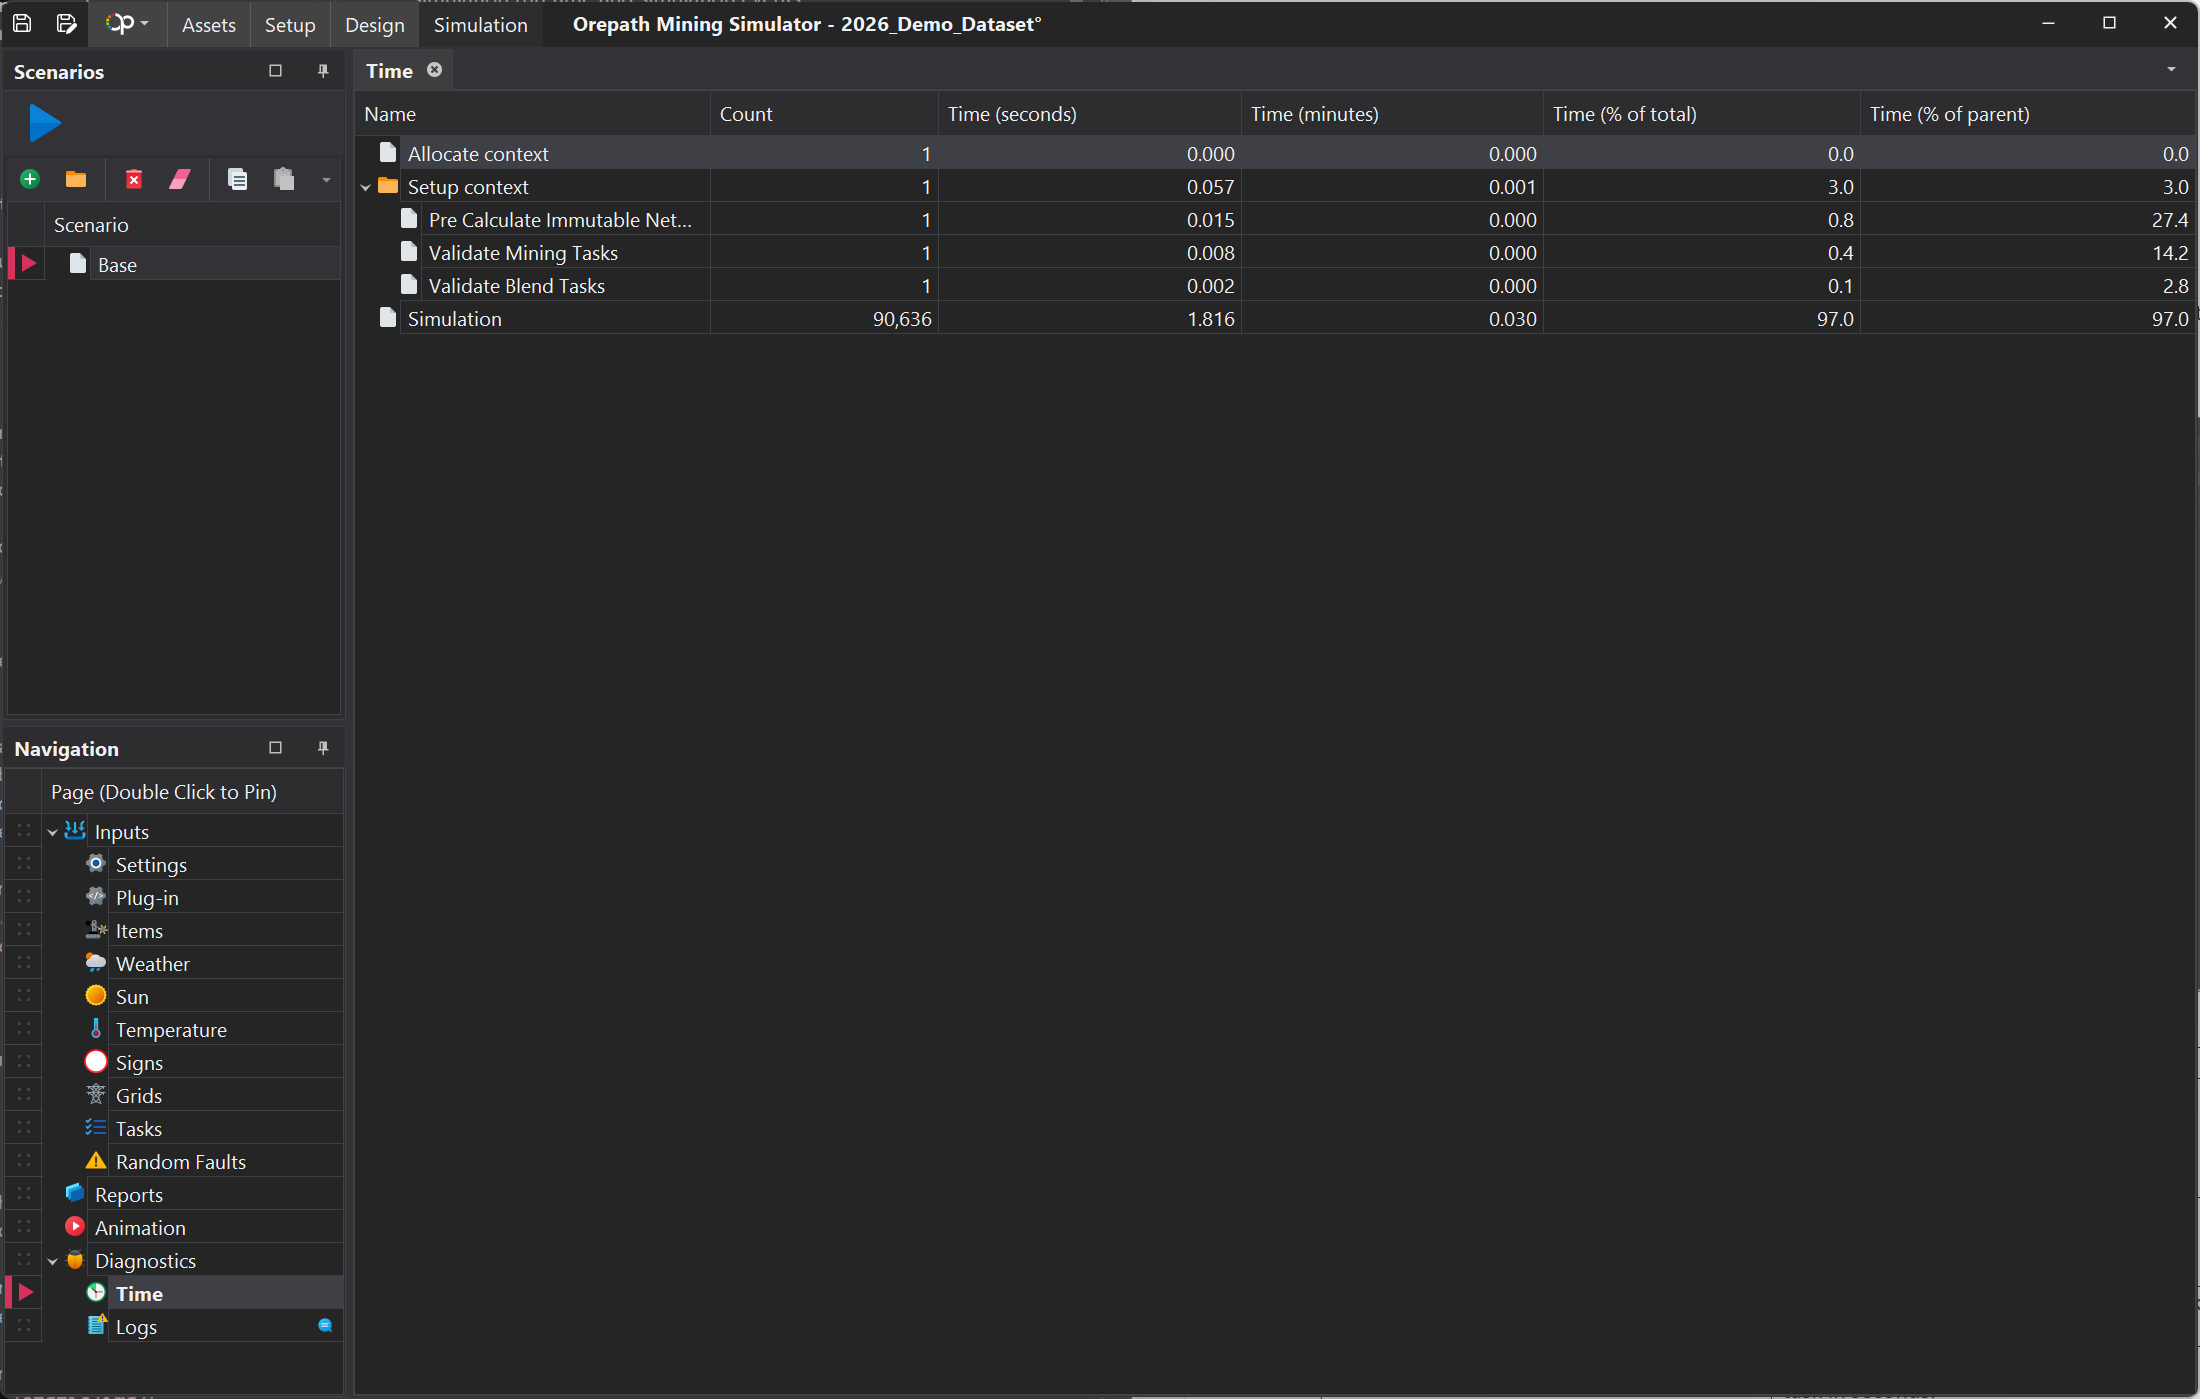
The Time tab is used to review simulation performance. It shows how long each stage of the simulation takes, including setup, validation, and simulation processing. This information can help identify which parts of the simulation require the most processing time.
| Section / Column | Description |
|---|---|
| Diagnostics – Time | Displays the processing time used by each stage of the simulation. This helps identify which part of the simulation took the longest to complete. |
| Count | Shows how many times the process or task was performed during the simulation. |
| Time (seconds) | Shows the total processing time for the task in seconds. |
| Time (minutes) | Shows the total processing time for the task in minutes. |
| Time (% of total) | Shows the percentage of the total simulation processing time used by that task. |
| Time (% of parent) | Shows the percentage of processing time used relative to its parent process or main category. |
Logs
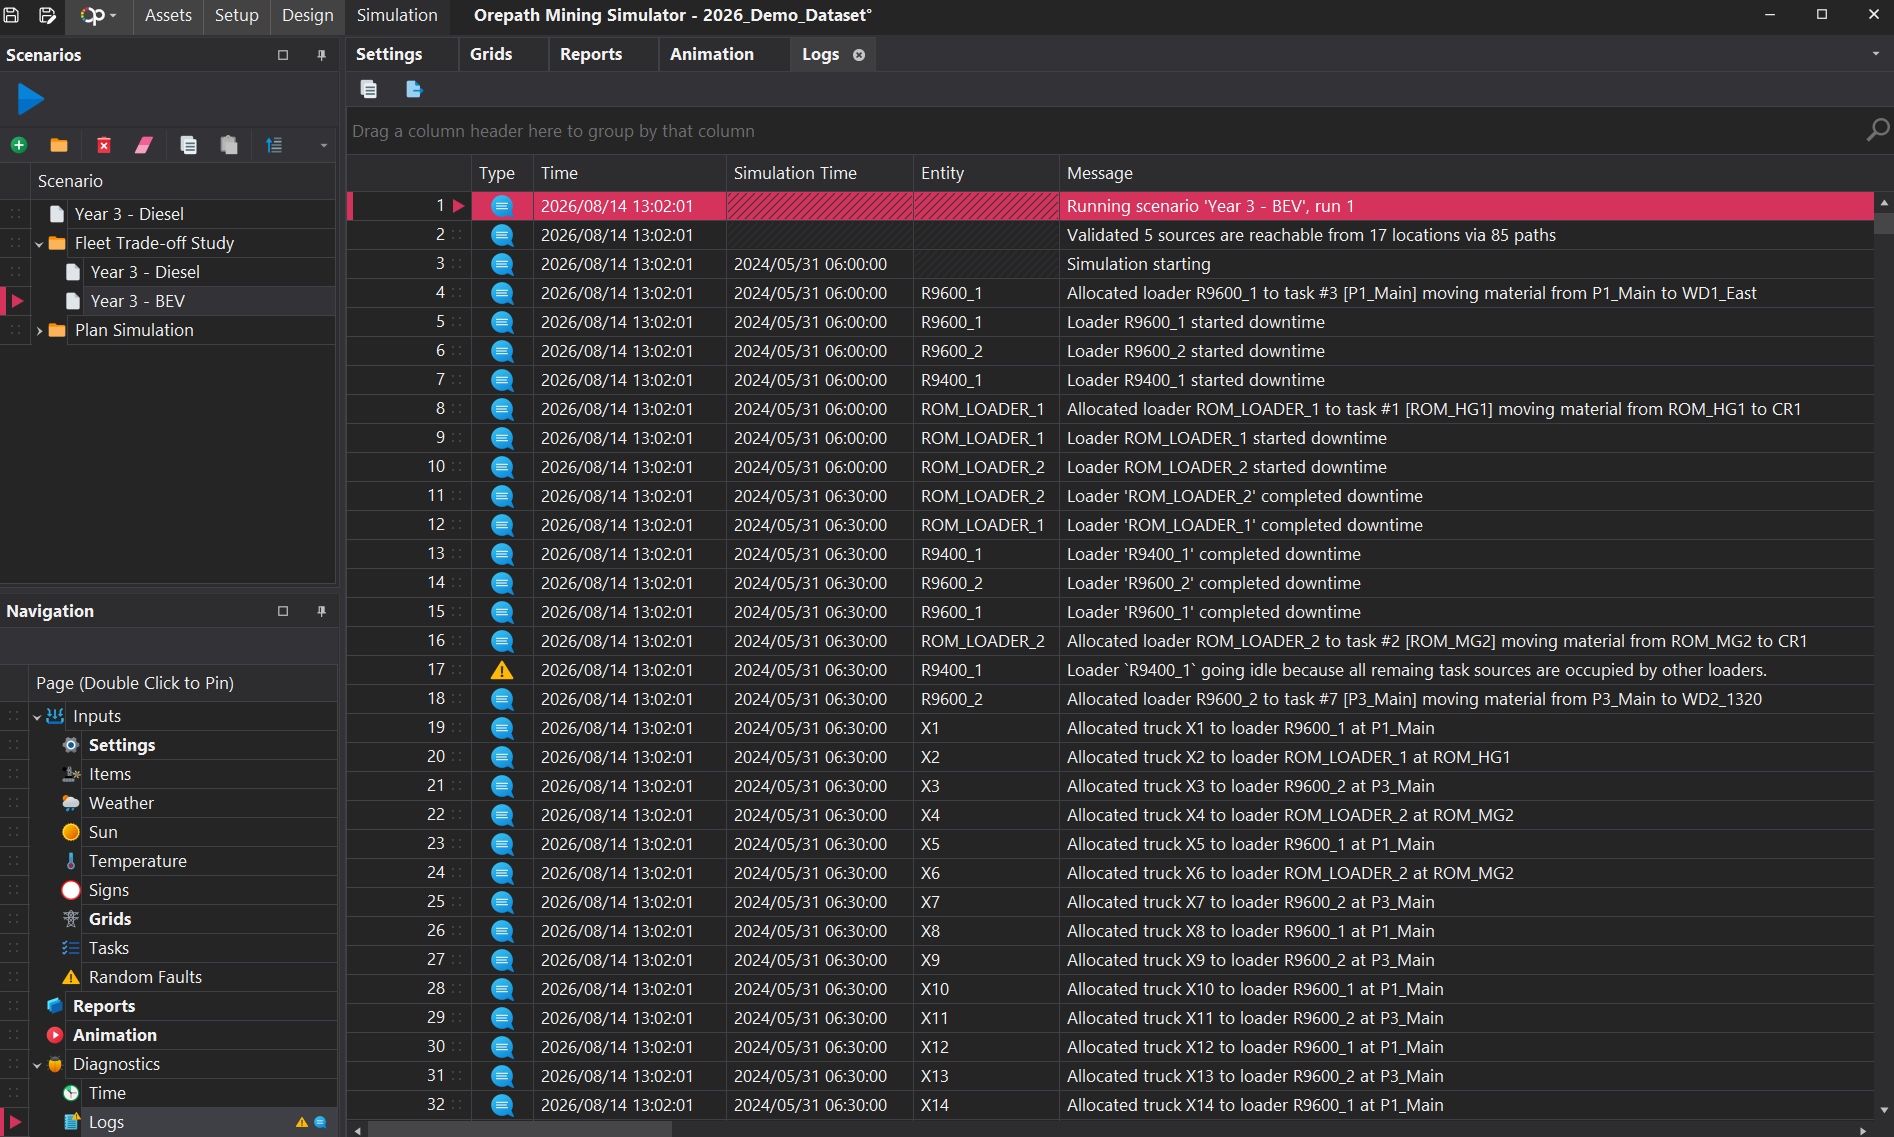
The Logs menu contains the record of all transactions and events that occur within the simulation. Events in the log include:
- Taske / Source allocation
- Occurence of downtimes
- Breakdown events
- Truck allocations
- Equipment being loaded/emptied
| Section / Column | Description |
|---|---|
| Diagnostics – Logs | Displays messages, warnings, and errors generated before, during, or after the simulation run. |
| Type | Shows the type and severity of the log entry. For example, an information message records normal simulation activity, while a warning or error indicates an issue that may require review. |
| Time | Shows the actual date and time when the log entry was recorded. |
| Simulation Time | Shows the time within the simulation when the event occurred, where applicable. |
| Entity | Shows the item related to the log entry, such as a truck, loader, crusher, road network item, or other simulation object. |
| Message | Provides details about the event, warning, or error that occurred. |
Filtering Log Entries
Each column in the Logs tab includes filtering controls that can be used to narrow the displayed log entries. Filtering is useful when a simulation produces many messages and the user needs to focus on a particular issue, item, or period of activity.
Users can apply one or more filters at the same time. For example, a user can filter the log to show only warnings for a selected truck, or only errors related to a particular crusher.
| Filter Example | Purpose |
|---|---|
| Filter by Type | Use the Type column filter to show only warnings or errors. This is useful when reviewing issues that may require action, rather than normal information messages. |
| Filter by Entity | Use the Entity column filter to display messages related to a specific item, such as a particular truck, loader, crusher, or network item. |
| Filter by Simulation Time | Use the Simulation Time column filter to review events that occurred during a particular part of the simulation. This can help isolated that have occured within specific dates, time windows or shifts. |
| Filter by Message | Use the Message column filter to search for a specific word or phrase, such as unreachable, not loaded, or warning. |
| Apply Multiple Filters | Combine filters to focus on a specific issue. For example, filter Type to show warnings and filter Entity to show only entries related to Truck 01. |
| Clear Filters | Remove one or more active filters to return to the full list of log entries. |
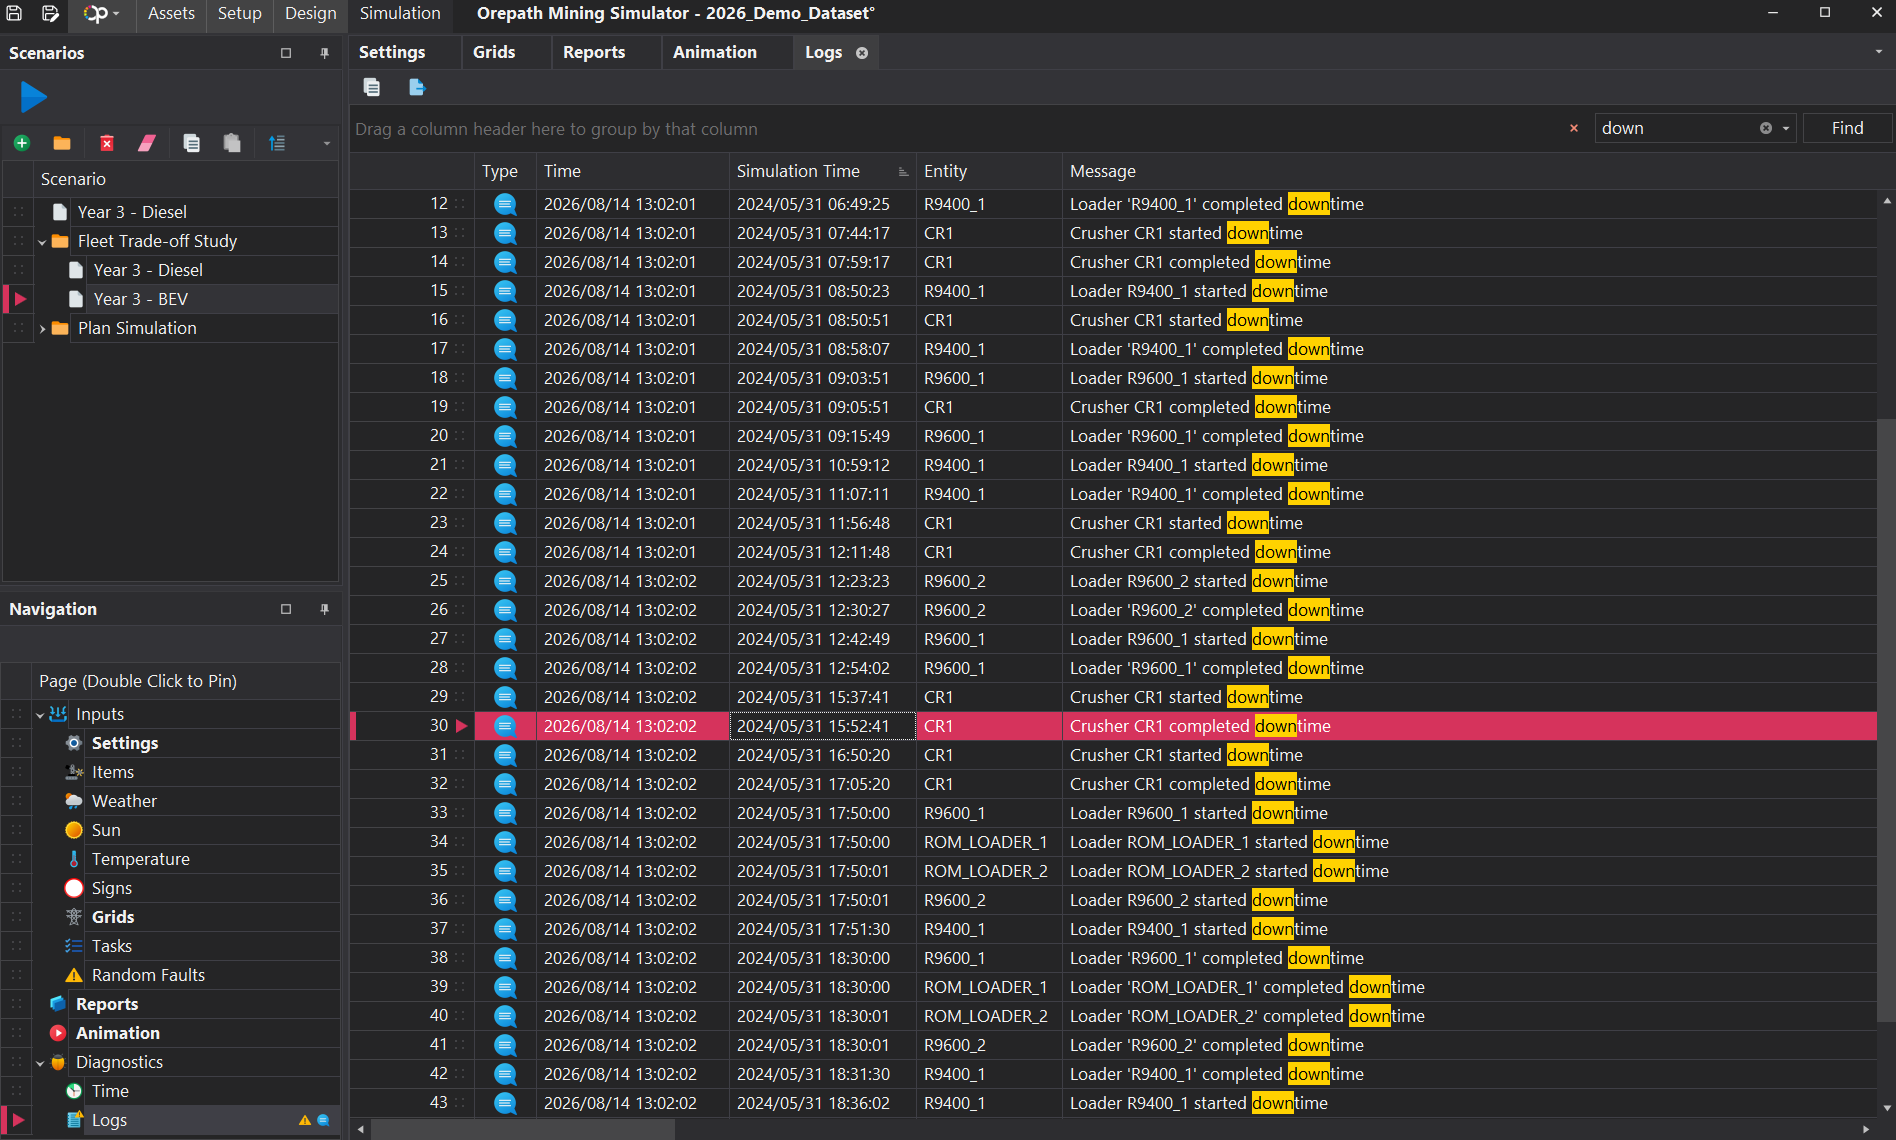
All logged events can be searched using the magnifier icon highlighted below.
Any terms searched within the Diagnostic logs are filtered and highlighted.
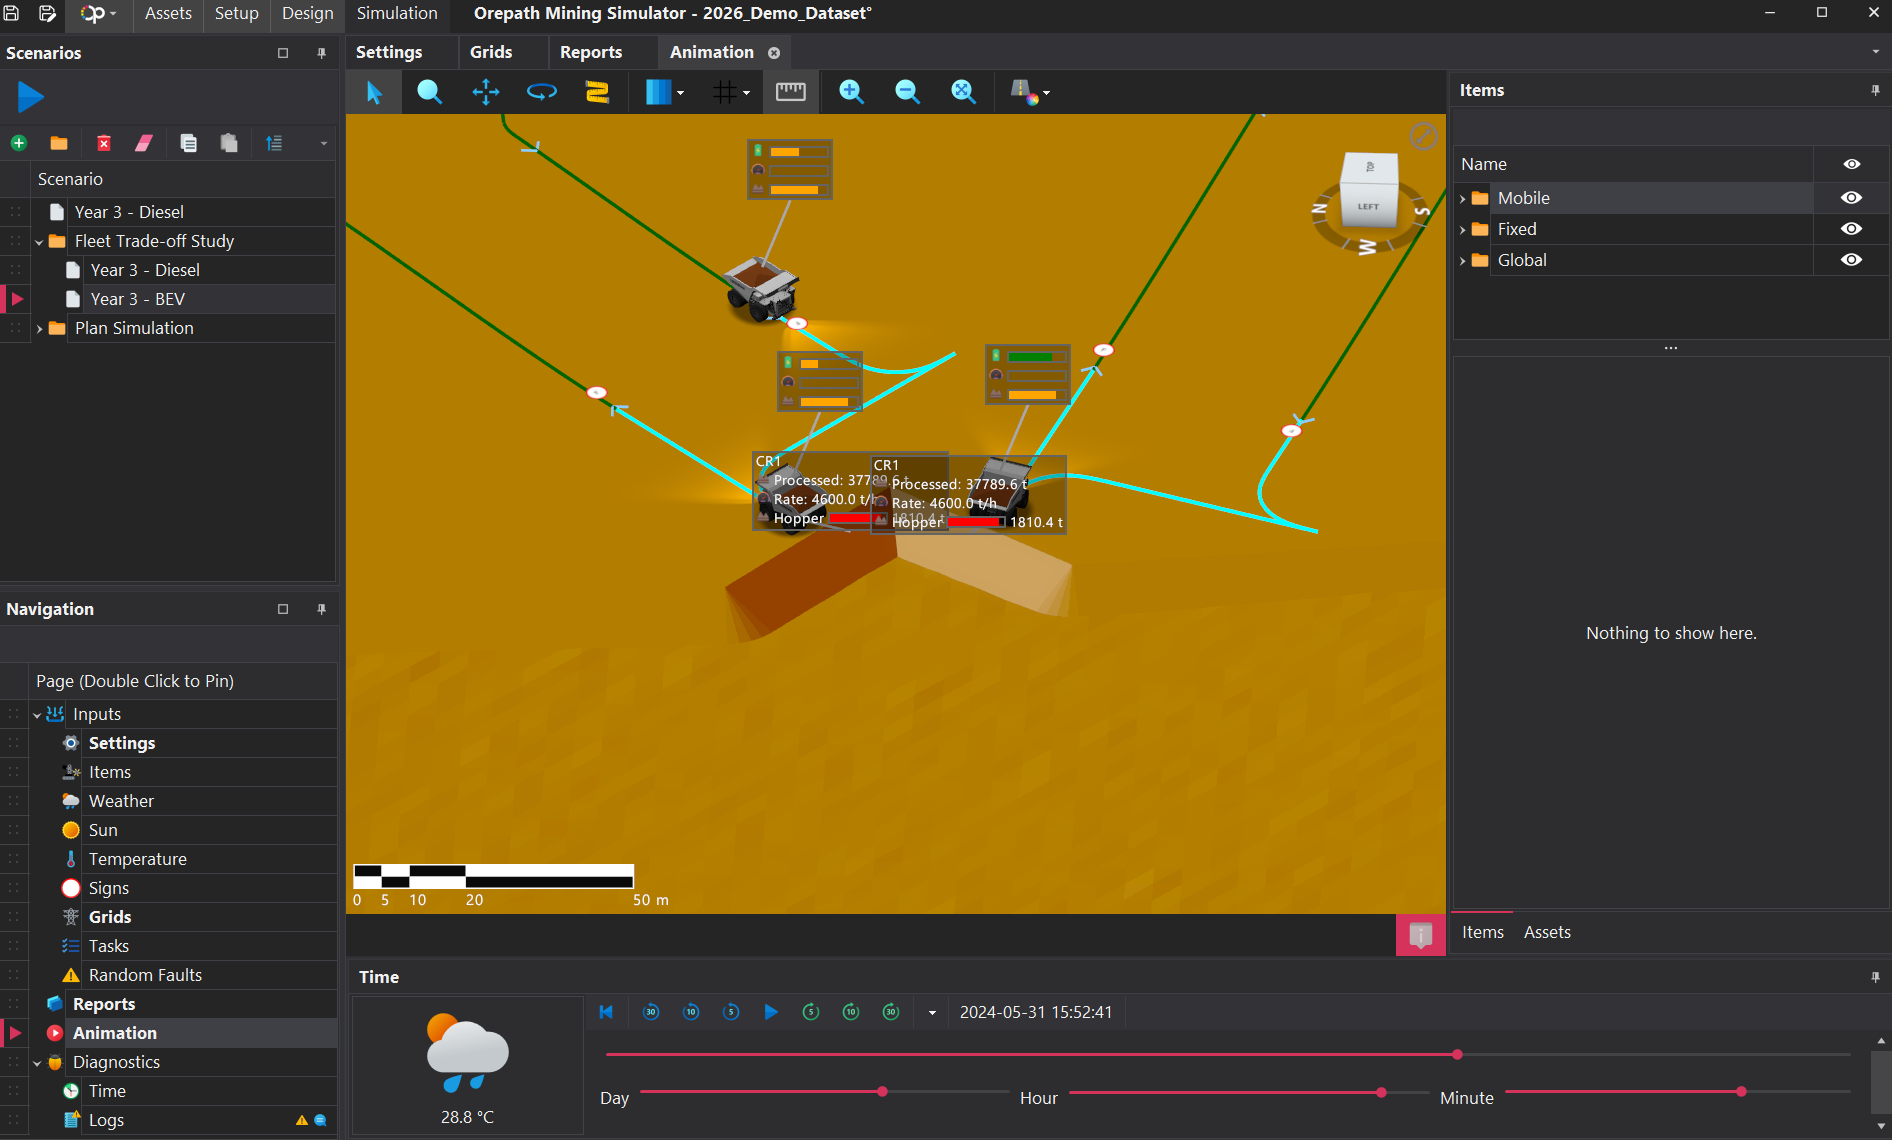
Double-clicking on a log entry will direct the user to the respective time within the Animation tab, allowing users to see the event of interest immediately.